
Q2 2025 Market Recap and Outlook
The second quarter of 2025 saw markets move from panic to manic, as the early April market spiral caused by Trump’s haphazard “Liberation Day” tariffs abruptly reversed course when a 90-day pause was announced just a week later. The rebound was swift, with markets roaring back to all-time highs by mid-June, despite waning consumer confidence, increasing recession odds and businesses taking a cautious approach to investment and hiring. It was a dizzying turnaround for U.S. stocks, which were down more than -13% at one point but ended the quarter with a gain of +10.9%, while Canadian stocks were up more than 8%. Bond and currency markets were not spared from the volatility, with bond yields spiking and the U.S.
Dollar Index falling more than -7% in the quarter, thanks to renewed concerns about inflation and an unsustainable fiscal picture in the U.S.
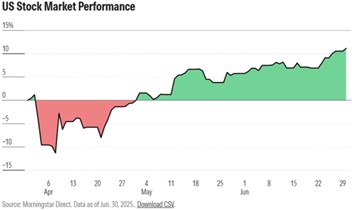
The strong performance of U.S. markets in the quarter (S&P 500 Index +10.9%, Dow Jones Industrial Average +5.5%, NASDAQ Composite Index +17.9%) was led by the technology (+23.7%) and communications services (+18.5%) sectors, both of which had been laggards in the first quarter. The energy and health care sectors fell -8.6% and -7.2% respectively, in a complete reversal of Q1 fortunes. The Magnificent Seven stocks once again accounted for more than half of the market gains in the quarter, despite a lacklustre quarter from Apple (-7.5%). Dividend and value stocks lagged, as the Morningstar Dividend Composite Index was up +3.7% in Q2, while the Morningstar U.S. Value Index was up just +1.3%.
Canadian stocks experienced a similar quarter to the U.S., with the S&P/TSX Composite Index up +8.5% despite being down nearly -11% in early April. All 11 Canadian sectors posted positive returns for the quarter, led by information technology (+14.2%) and consumer discretionary (+14.1%). Energy was the laggard, posting a modest +1.3% gain.
The rotation of investors into international markets continued throughout the second quarter, as European markets followed through on their Q1 gains, with the MSCI Europe Index rising a further +6.0% in the quarter, now up more than +17% for the year in Canadian dollars. Attractive valuations and increased fiscal stimulus have been tailwinds, as has the broader anti-U.S. sentiment. Chinese markets faltered in Q2, due to a slowing GDP and rising trade tensions with the U.S. That said, the MSCI China Index still managed to eke out a 2.6% gain in the quarter.
Bonds and currencies (specifically, the U.S. dollar) had an eventful quarter as well, as concerns about U.S. fiscal sustainability – thanks to deficit spending in the so-called “Big Beautiful Bill” – exacerbated a declining global appetite for U.S. dollars and debt. The yield on 30-year U.S. Treasuries soared above 5% in May, before falling back to 4.79% (though it remains near 15-year highs). While most of the bond market remains positive year- to-date, returns for Q2 were generally down, as the FTSE Canada Bond Universe fell -0.6% and the Morningstar Global Core Bond Index declined by -1.1%. As mentioned earlier, the U.S. Dollar Index fell more than -7% in the quarter, its worst first half of the year in more than 50 years. Erratic trade and immigration policies, as well as concerns about the nation’s economic stewardship seem to be eroding foreign investors’ trust in the dollar.
While investors will be relieved to see the early quarter losses erased so quickly, the rapid rise back to all-time highs leaves us somewhat uneasy. We expect tariffs and unpredictable trade policy, coupled with geopolitical risks, to lead to continued volatility in the second half of the year.
OUTLOOK – Headline Fatigue
Investors can be forgiven for feeling a bit exhausted. It feels like every day we are subjected to a new barrage of news articles, tweets, and rumours about U.S. trade policy and the on-again, changed-again, paused-again tariffs. The wild swings investors endured earlier in the year have given way to a steady, almost indifferent, march higher for markets. In recent weeks, tariff headlines and mixed economic data have barely caused a ripple in markets, and while the old adage says, “a bull market climbs a wall of worry,” headline fatigue (where investors basically avoid/ignore all news due to feeling overwhelmed and emotionally drained by the constant bombardment of information) may now be playing a part.
As mentioned earlier, this leaves us feeling a little uneasy in the shorter term. We came into 2025 feeling that investors might be a shade too complacent, and while the volatility of March and April gave investors a jolt, they again seem content to look past the worst-case scenarios and embrace the “U.S. exceptionalism” theme. Make no mistake, there are many reasons for optimism… solid corporate earnings, excitement around artificial intelligence, and resilient consumer spending have all fuelled the rally. Beneath the surface though, several warning signs suggest this may not be the time for investors to get too comfortable.
First, valuations across many sectors (especially technology) are once again stretched. Price-to-earnings ratios have climbed well above historical averages, implying high expectations for future growth. Any disappointment – whether in corporate earnings, economic data, or interest rate decisions – could lead to market weakness. The Federal Reserve, while signalling potential rate cuts, continues to stress its dependence on data. Inflation remains sticky, and the labour market, though cooling, is still relatively strong. This creates a narrow path for the Fed, and markets may be overestimating how dovish policymakers can afford to be.
Second, a divergence between soft and hard economic data is becoming more pronounced. Soft data, typically sentiment-based indicators of consumer and business confidence, has been weak or deteriorating, which is normally indicative of a downturn. On the other hand, hard data – quantifiable measures of actual spending and economic activity, like GDP growth and retail sales – has remained resilient, indicating the U.S. economy continues to grow, albeit more slowly. This divergence creates uncertainty, as the perception of the economy doesn’t match the measurable activity. Soft data often leads hard data, as shifts in sentiment can precede changes in behaviour. If consumers still have lingering trauma from high inflation and affordability issues, it may lead them to spend less. Likewise, if businesses feel uncertain about the economy, they may delay projects or freeze hiring, all of which will start to trickle down to the hard data.
Complicating this further is the impact of tariffs. The Trump administration is increasing pressure by threatening major trading partners with new tariff rates (some in excess of 30%), as few trade deals have been signed to date and negotiations seem to be stalling. Part of the concern here is that many consumers and businesses pulled forward spending plans to avoid tariffs, so perhaps the resilient hard data is just reflecting this surge in business and data will weaken as the year progresses. Recent evidence is that Americans are becoming more cautious with their spending.
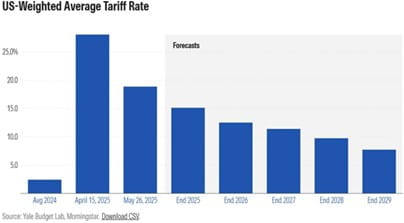
It is hard to think that the impact of tariffs won’t be material. Consumer spending is the lifeblood of the U.S. economy (accounting for roughly 70% of GDP) and despite the Trump administration’s claims, tariffs are nothing more than a tax on U.S. consumers and businesses. Economists at Goldman Sachs estimate that companies will pass on 70% of the direct cost of tariffs to consumers through higher prices, exacerbating inflationary pressures and reducing consumer demand. Even if some of the most extreme tariffs are walked back, the average tariff rate will still be at its highest level in nearly 100 years! Morningstar chief U.S. economist Preston Caldwell expects tariffs to average 11.5% between 2025 and 2029, compared to just 2.4% in 2024. This is cost that will be borne by U.S. businesses, and ultimately consumers, which is likely to reduce profit margins, weigh on corporate earnings, and ultimately affect stock prices.
Lastly, geopolitical risks also remain a wild card. Ongoing tensions in Eastern Europe, the Middle East, and the Taiwan Strait have the potential to rattle markets unexpectedly. Add to that, questions around U.S. fiscal stability and its impact on bond yields, and the risk of sudden volatility rises.
We always have and always will believe that investors give themselves the best chance of long-term success by staying invested in equities, but we also feel that now is not the time for blind optimism or excessive risk-taking. U.S. markets contain world-class companies that deserve a position in every portfolio. However, during these times of high uncertainty, investors who are overweight U.S. equities may be wise to revisit their allocations to safer investments like bonds, preferred shares, and GICs (especially for any funds required in the next 12-24 months), while also considering diversifying geographically. A well-diversified portfolio will be an investor’s best defence as we move into a more uncertain second half of the year.
If you’d like a review of your positioning and/or have any questions or concerns, please don’t hesitate to reach out.
This Quarterly Market Commentary has been prepared by Ryan Cramp and Michael Higgins and expresses the opinions of the authors and not necessarily those of Raymond James Ltd. (RJL). Statistics and factual data and other information are from sources RJL believes to be reliable but their accuracy cannot be guaranteed. The client account performance may vary from the model portfolio due to several factors, including the timing of contributions and dates invested in the model. The performance reported is that of the account that represents the model, not a composite. Performance calculation for the models may be different than the index used as a reference point. It is for information purposes only and is not to be construed as an offer or solicitation for the sale or purchase of securities. This Quarterly Market Commentary is intended for distribution only in those jurisdictions where RJL and the author are registered. Securities-related products and services are offered through Raymond James Ltd., member-Canadian Investor Protection Fund.